Data views
TriplyDB offers three views for exploring the contents of a dataset in the browser, with no service or query needed: the Linked Data Browser, the Linked Data Table and Insights.
Linked Data Browser
The Linked Data Browser shows one node at a time, described by its properties, which can be followed to other nodes in the graph.
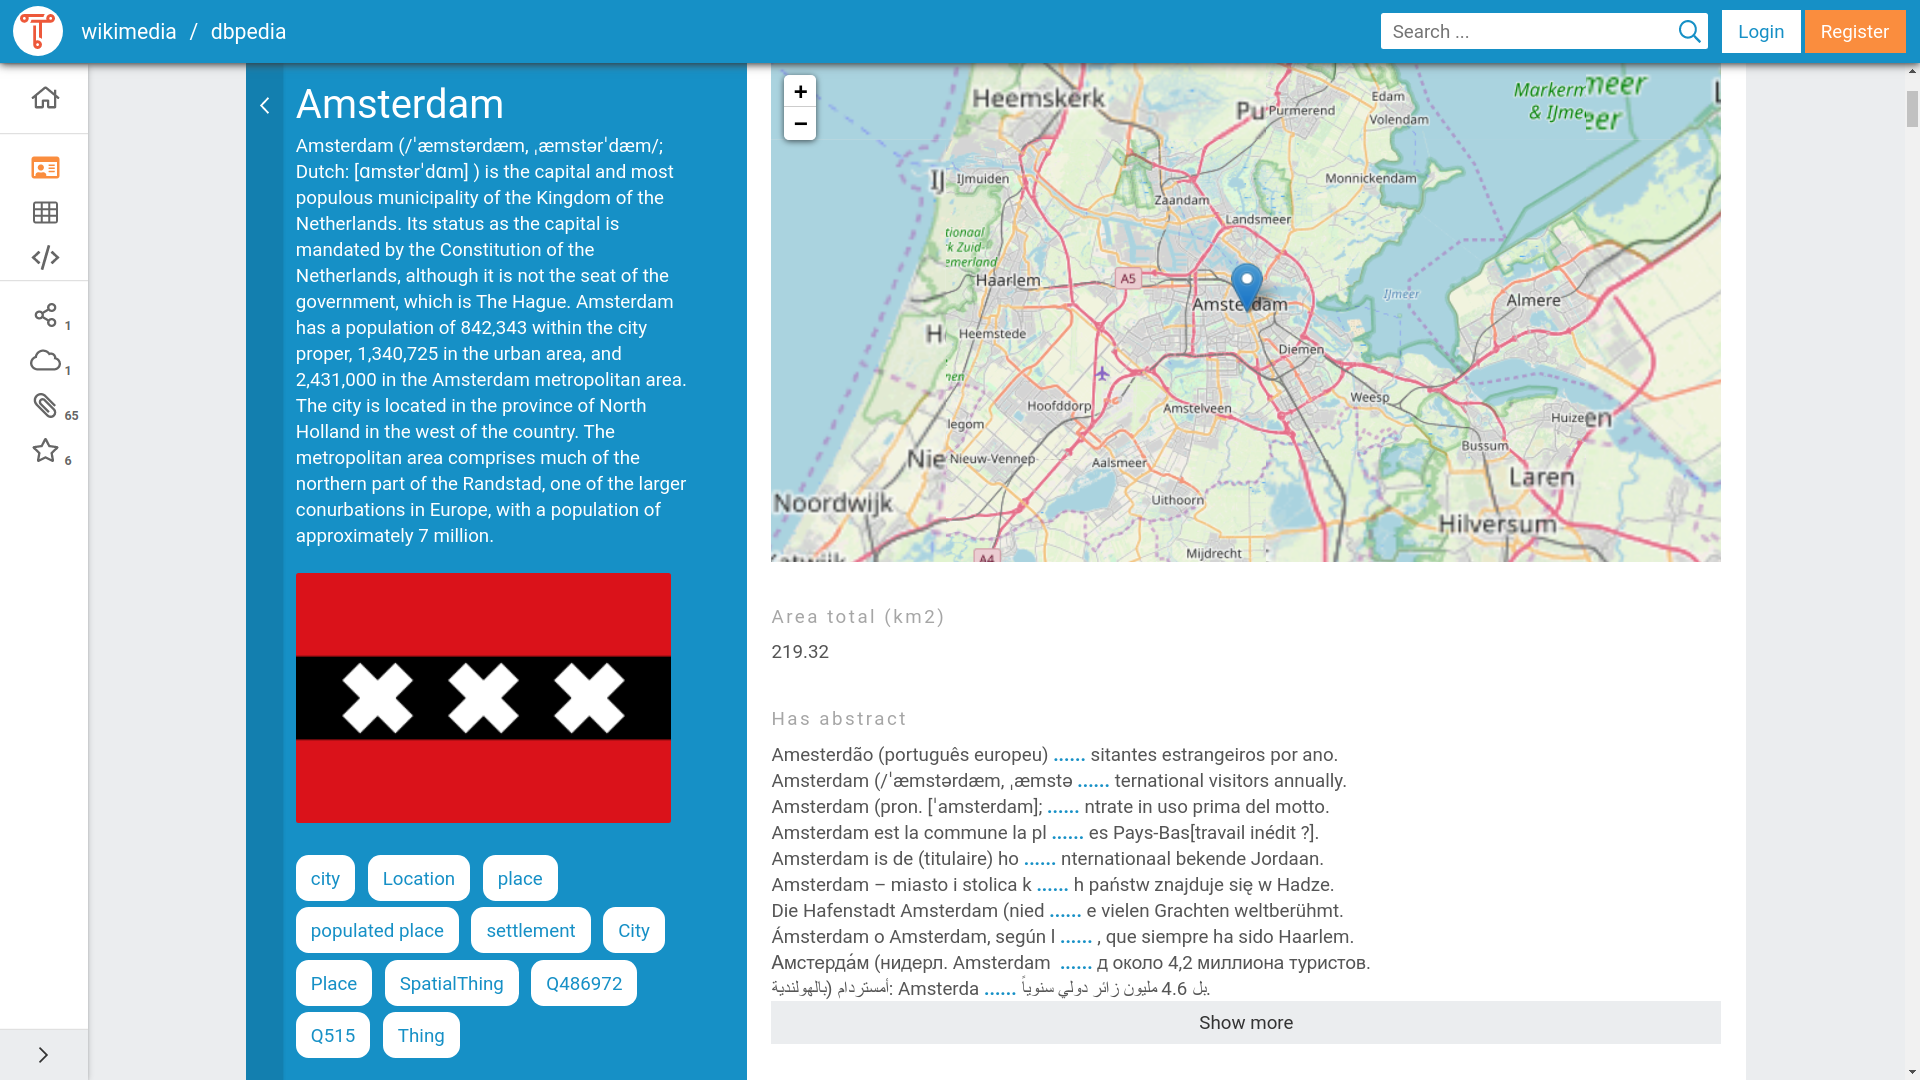
The browser renders some properties specially — as a type, a title, a map, an image, or an audio or video player:
| To get | Use |
|---|---|
| A type shown for the resource | rdf:type |
| A readable title | rdfs:label, skos:prefLabel |
| A description | sdo:description, rdfs:comment |
| A map | geo:asWKT, geo:hasGeometry, geo:location |
| An image | foaf:depiction, foaf:thumbnail, foaf:img, sdo:image, sdo:contentUrl, class sdo:ImageObject |
| An audio player | sdo:audio, sdo:contentUrl, class sdo:AudioObject |
| A video player | sdo:video, sdo:contentUrl, class sdo:VideoObject |
Each is described below.
Types
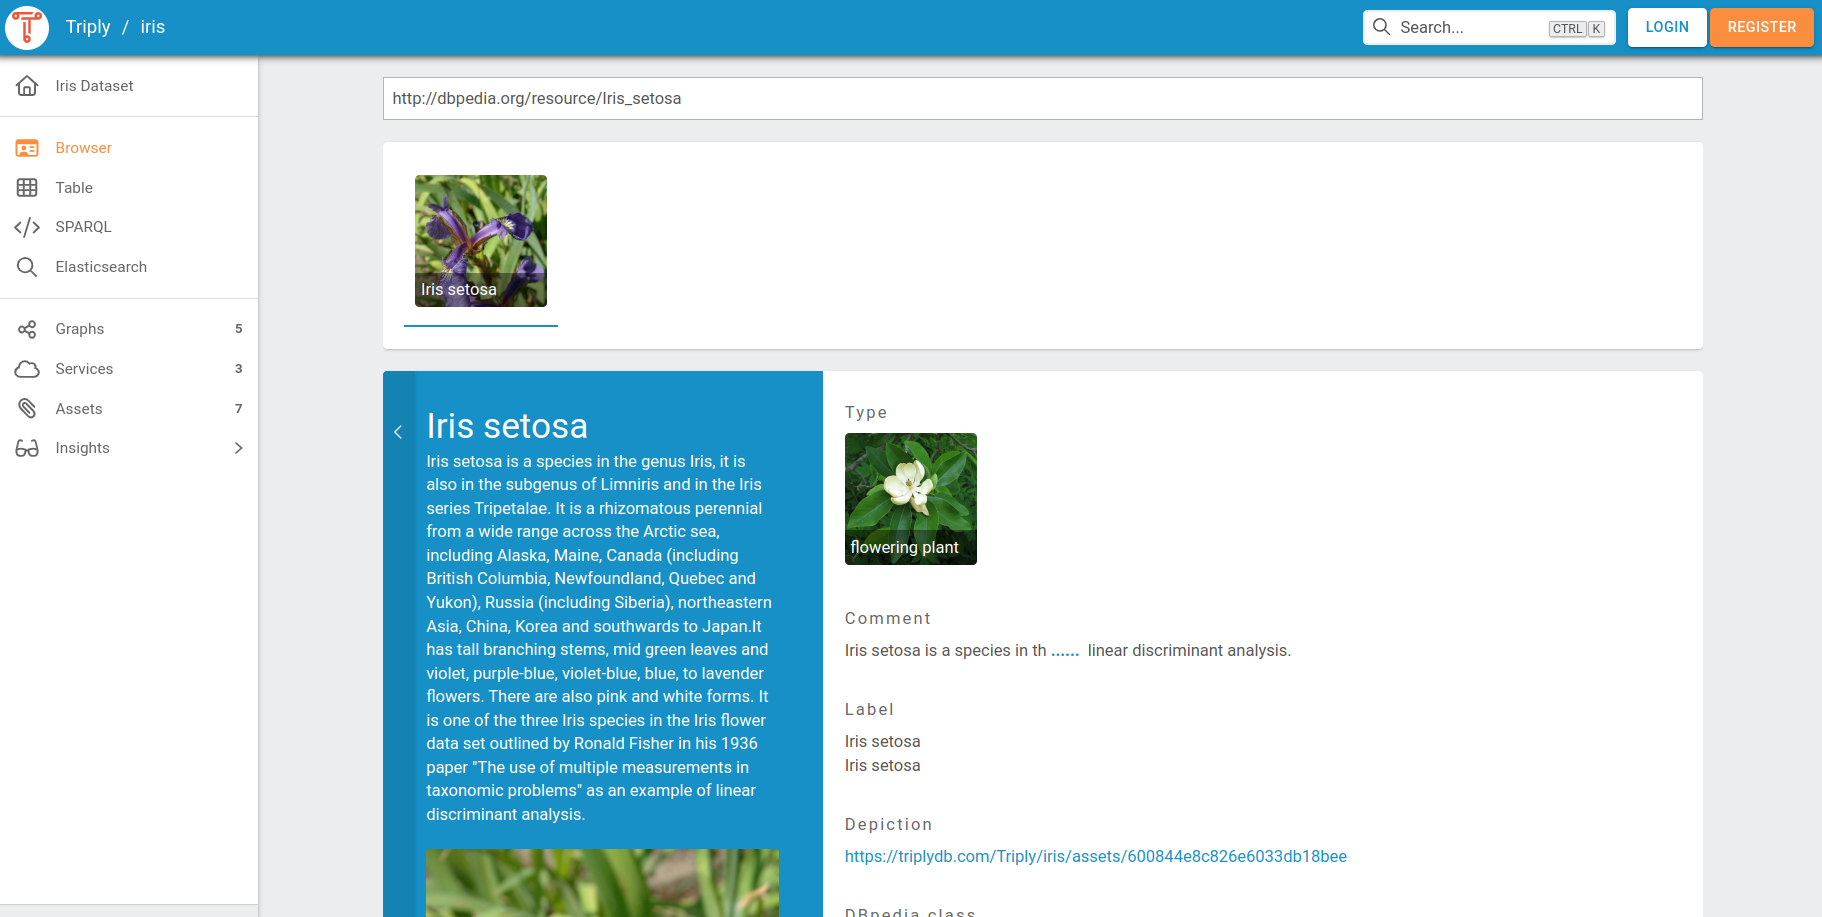
The predicate rdf:type gives the type or class of a resource, which the browser shows with it.
In the example below, you can see that "Iris setosa" is the type of flowering plant due to the usage of the rdf:type property.
Labels
Labels are typically used to provide a concise and meaningful title or display name for a resource, making it easier for users to understand the content of your linked data. These predicates allow you to provide human-readable labels or names for your resources:
- The property
rdfs:label - The property
skos:prefLabel
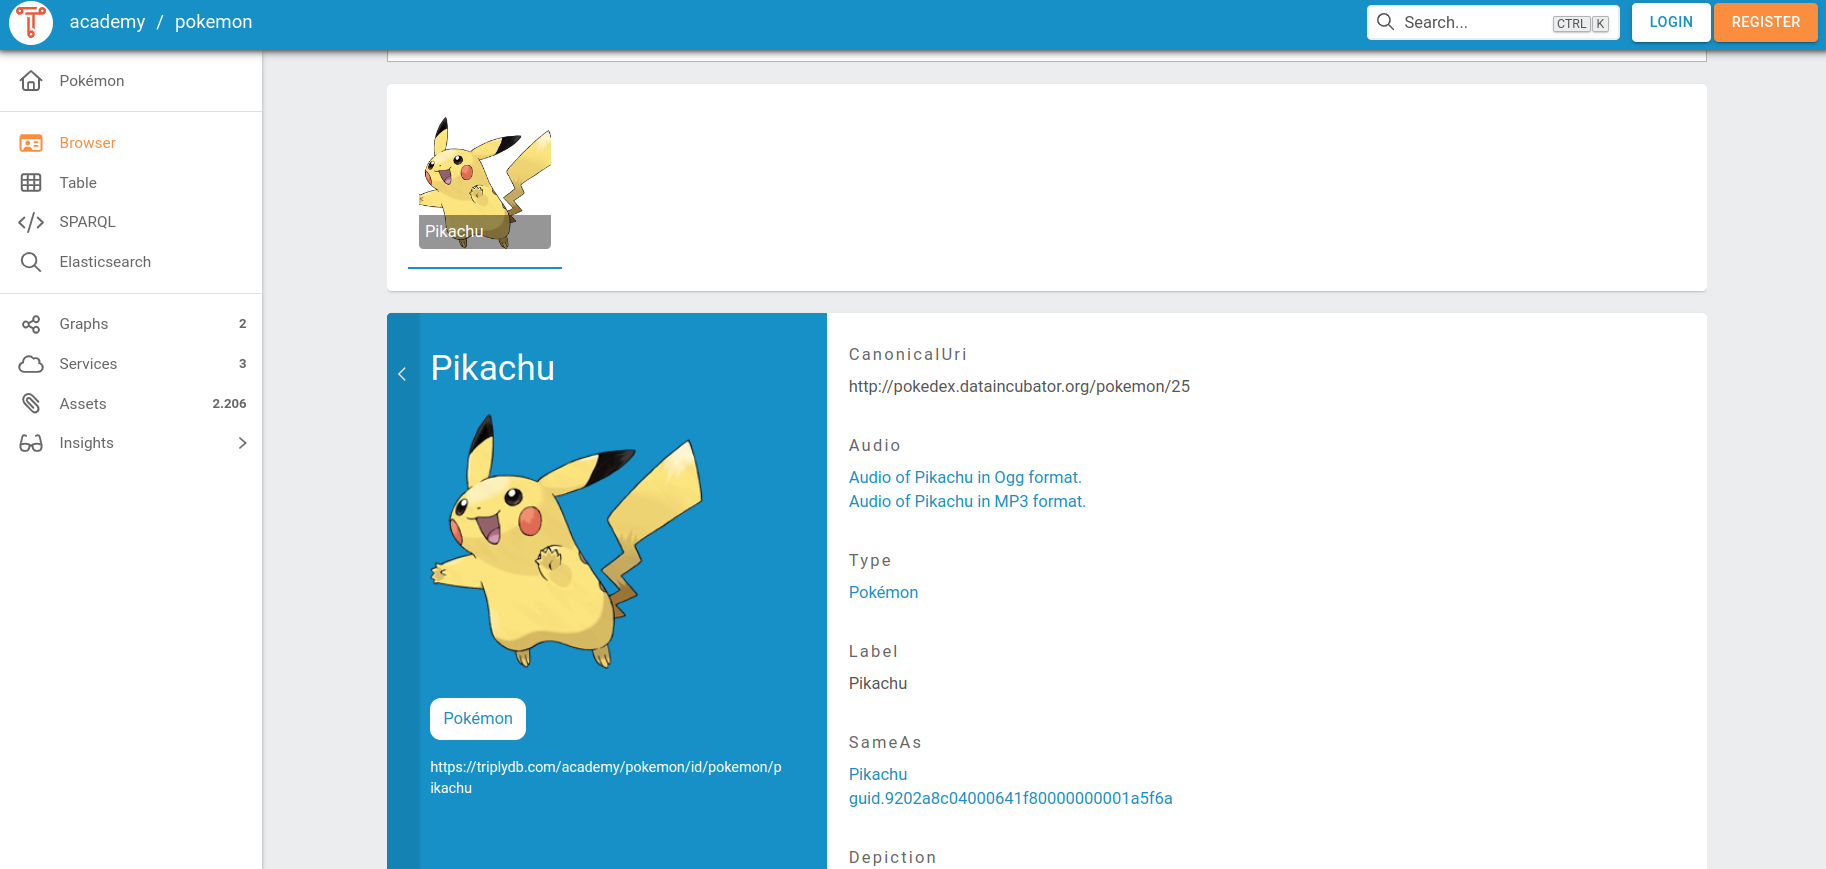
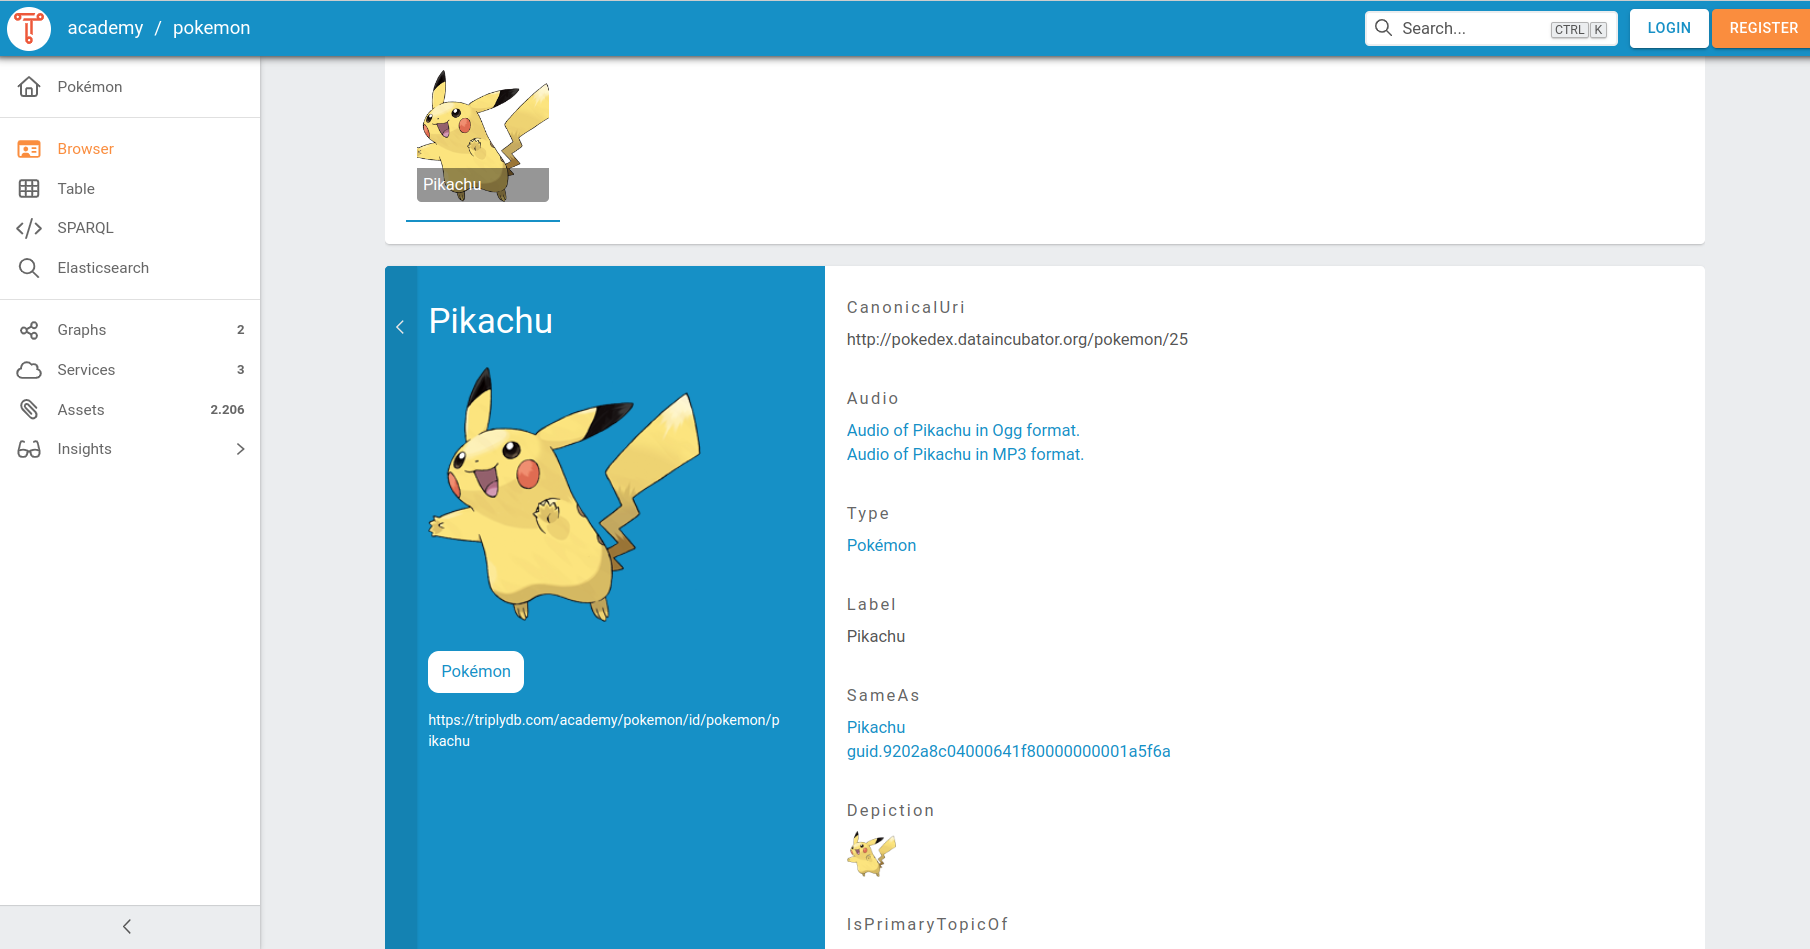
In the example below, the rdfs:label property was used to denote the label(name) of the Pokemon, resulting in the display of "Pikachu" above its corresponding image.
Descriptions
Descriptions can provide additional context or information about a resource, helping users understand its purpose, content, or significance. These predicates allow you to provide textual descriptions or comments about your resources:
- The property
sdo:description - The property
rdfs:comment
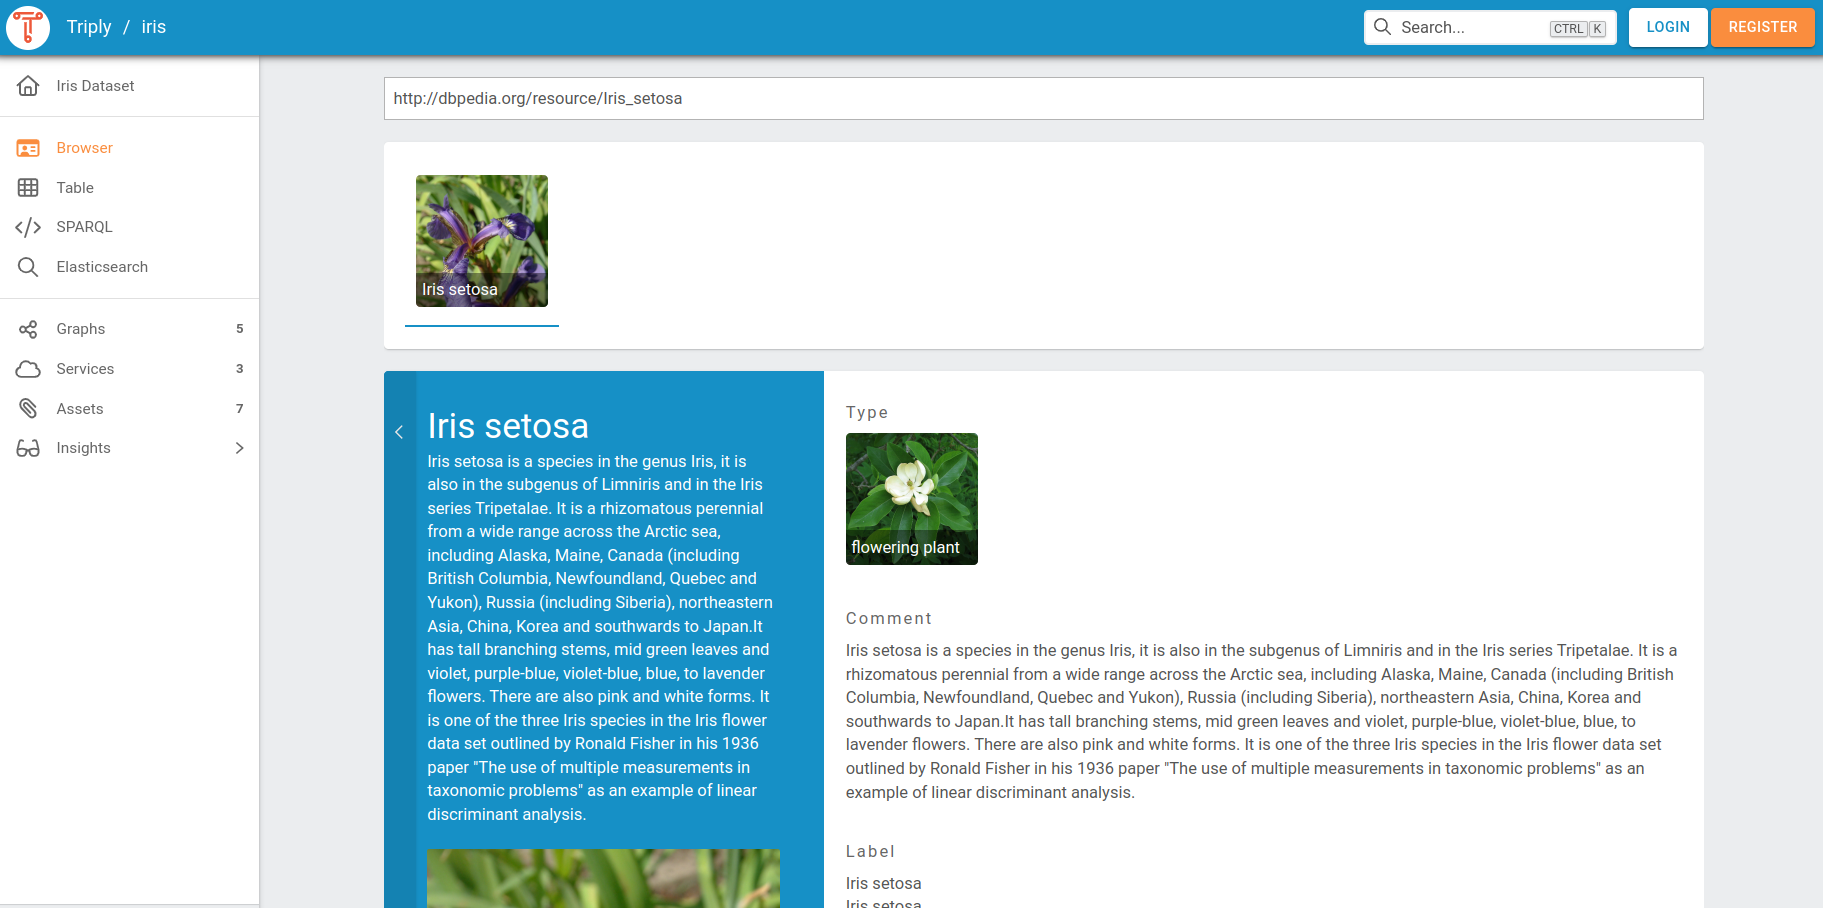
In the following example rdfs:comment was used to provide additional information on Iris Setosa.
Geo
These are some of the predicates used for representing geographic information in your LD-browser:
- The property
geo:asWKT: This property allows you to specify the geometries of geographic features using the Well-Known Text (WKT) format, which can be visualized on a map in the LD-browser. - The property
geo:hasGeometry: This property is used to link a geographic feature with its corresponding geometry. - The property
geo:location: This property is used to indicate the location of a resource using geographic coordinates, such as latitude and longitude, in your linked data.
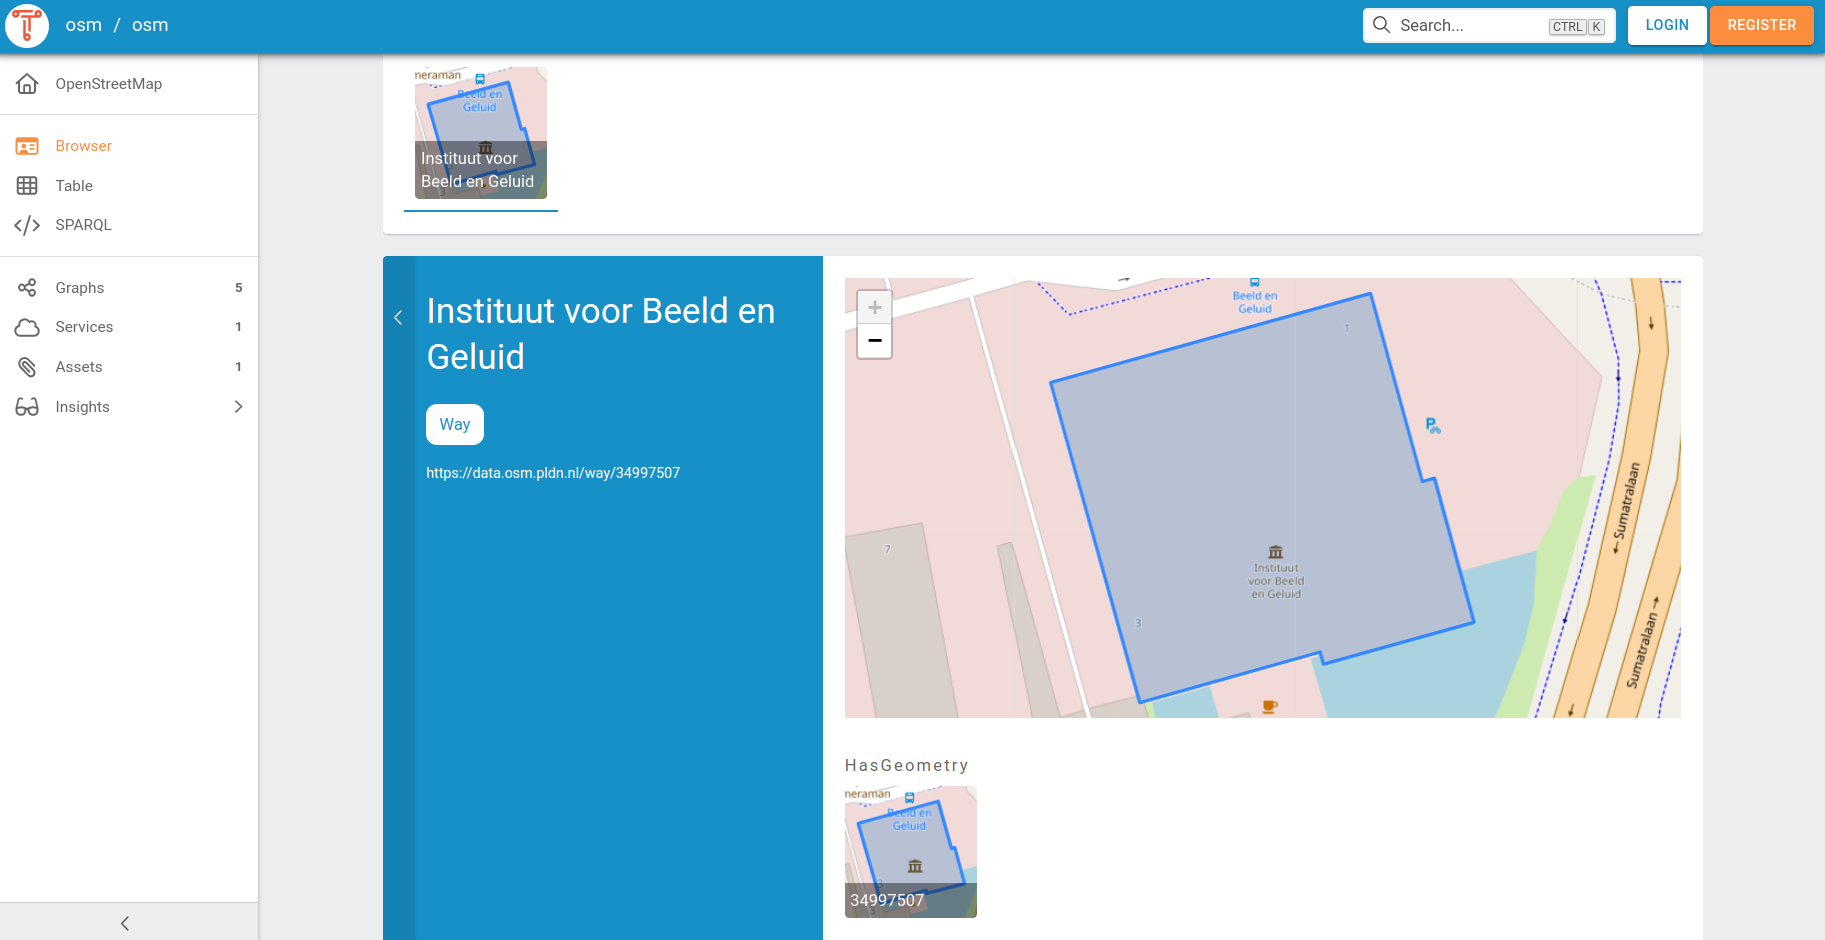
In the following example geo:hasGeometry property was used to showcase a map depicting the location of Instituut voor Beeld en Geluid.
See querying real-world data for the GeoSPARQL model behind these properties.
Images
These predicates allow you to associate images or visual representations with your resources:
- Class
sdo:ImageObject - The property
foaf:depiction - The property
foaf:thumbnail - The property
foaf:img - The property
sdo:image - The property
sdo:contentUrl
By using these predicates, you can provide URLs or references to images that can be displayed alongside your linked data in the LD-browser.
In the example below, foaf:depiction was used to display picture of Pikachu in the LD-browser:
Audio
These predicates allow you to associate audio content with your resources:
- The class
sdo:AudioObject - The property
sdo:audio - The property
sdo:contentUrl
You can use these predicates to provide URLs or references to audio files that can be played or streamed within the LD-browser.
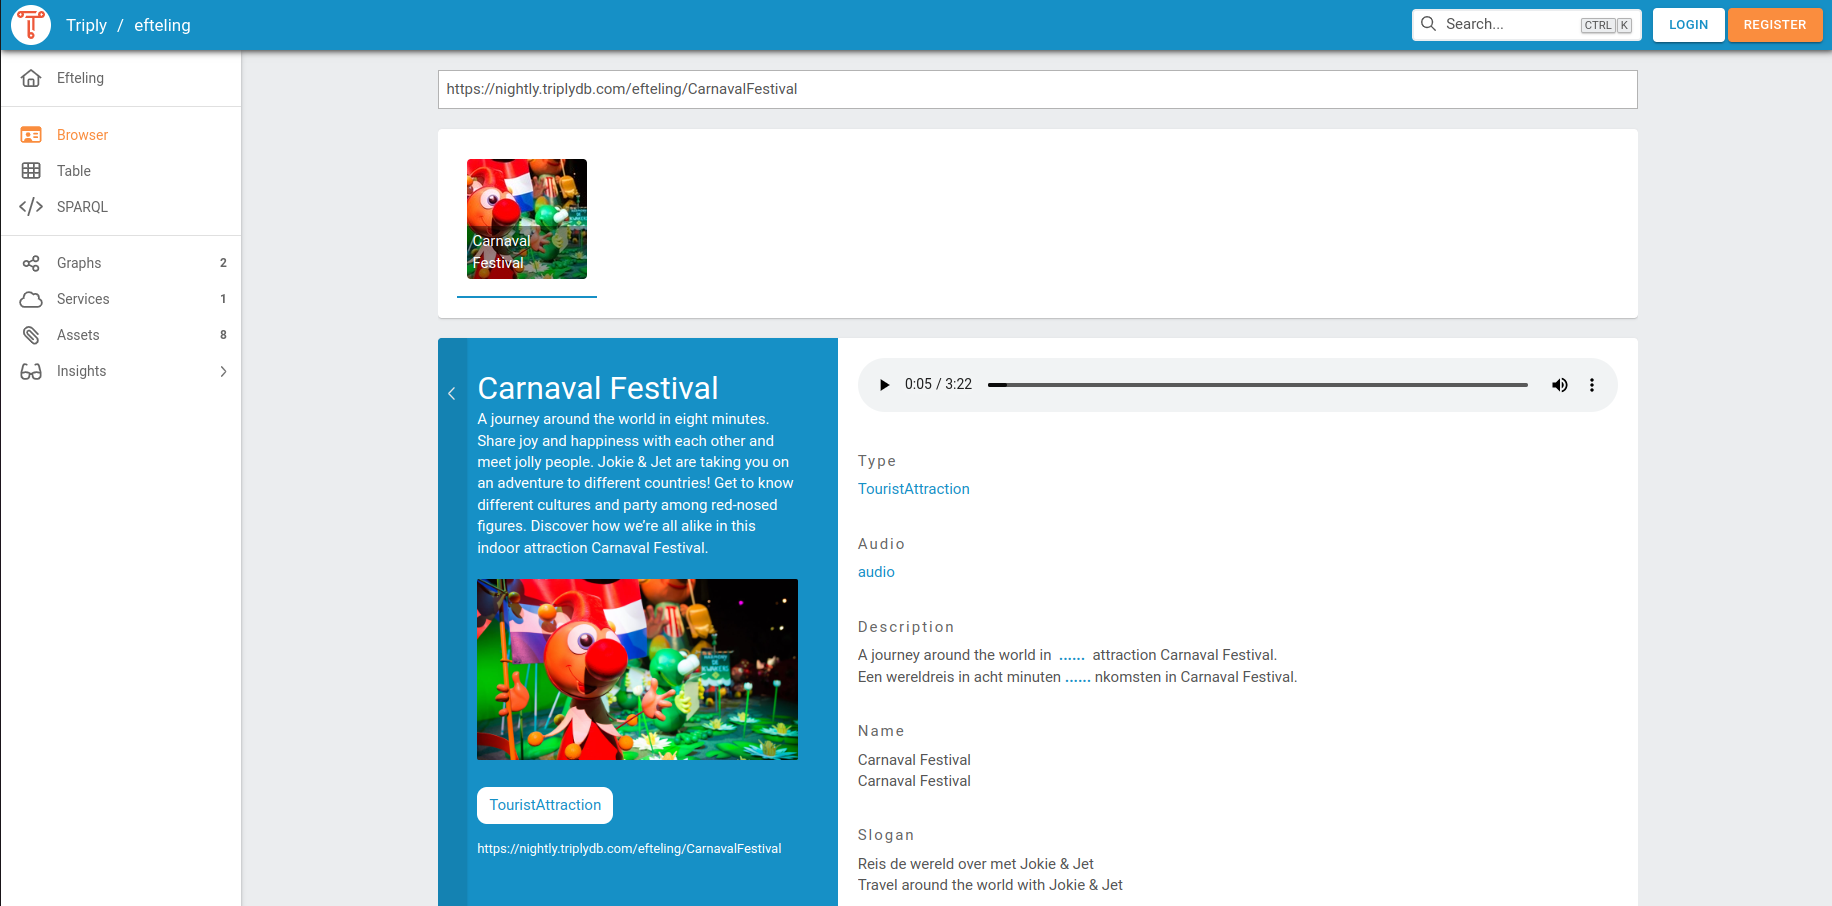
In the following example, sdo:audio links a recording to its audio file, which the LD-browser plays inline.
Video
These predicates allow you to associate video content with your resources:
- Class
sdo:VideoObject - Property
sdo:video - Property
sdo:contentUrl
You can use these predicates to provide URLs or references to video files that can be played or streamed within the LD-browser. The supported video formats are .mp4, .webm and .ogg.
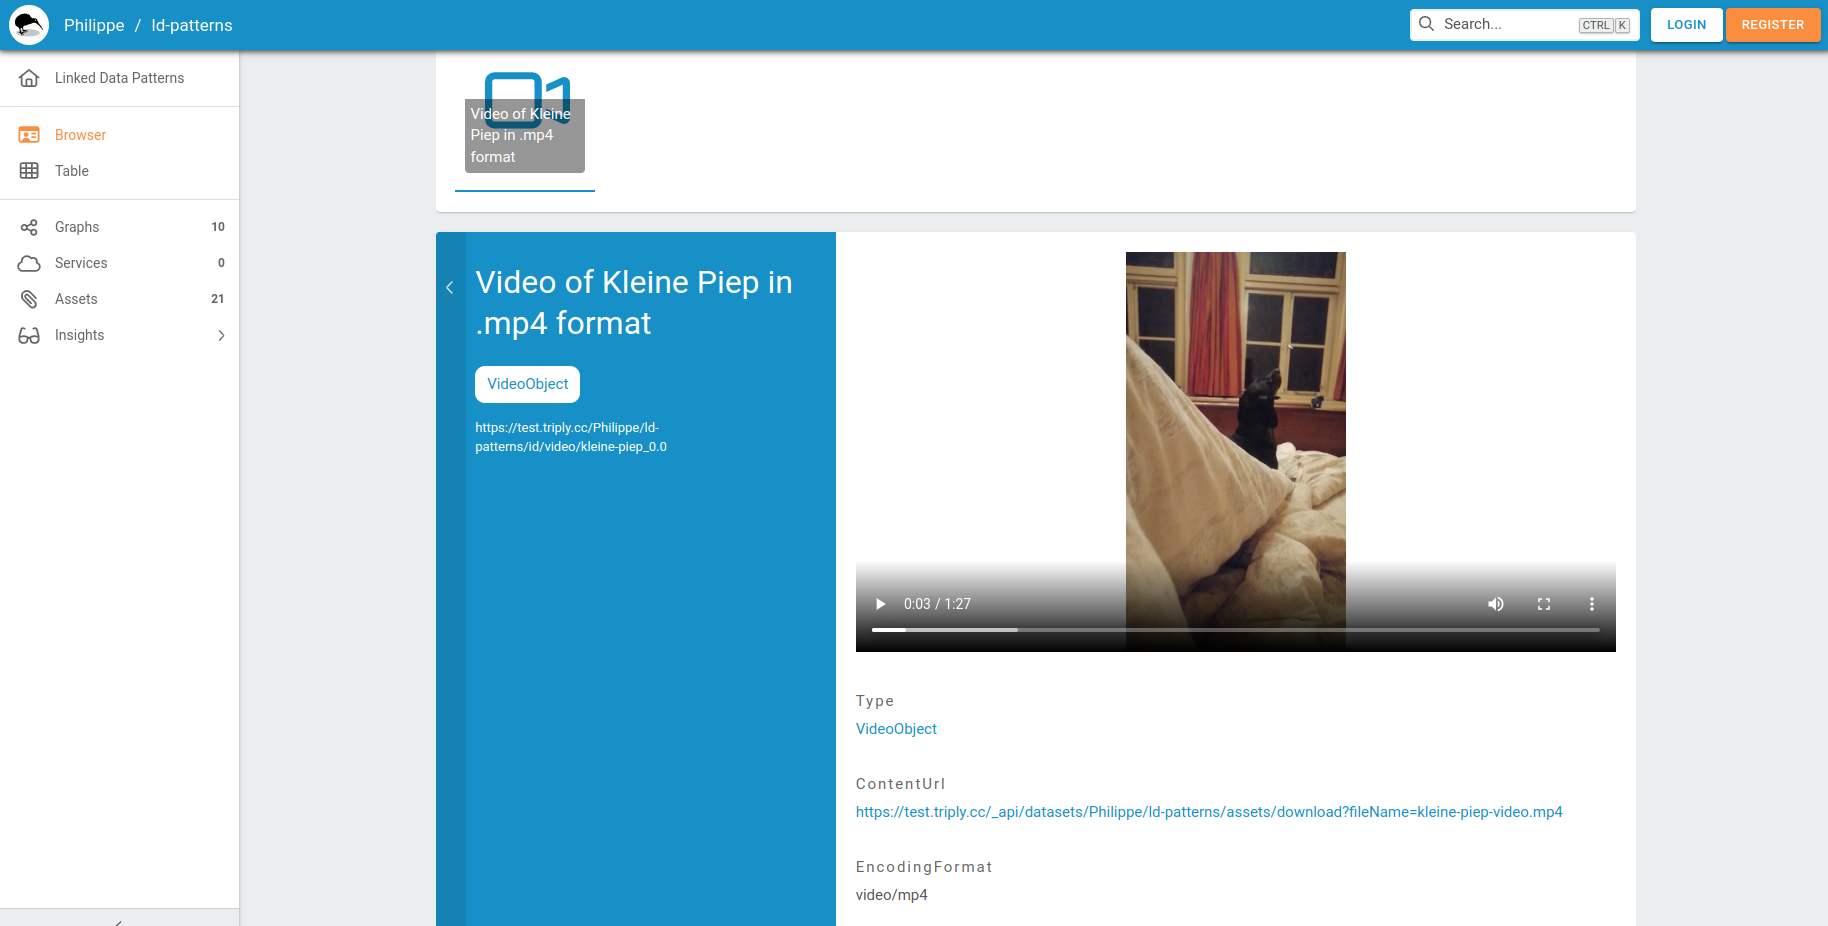
In the following example, sdo:contentUrl links a video sample to its file, which the LD-browser plays inline.
Linked Data Table
The linked data Table shows a dataset at the triple level. The first three columns represent the subject, predicate, and object position of the triple. The fourth column represents the graph to which the triple belongs.
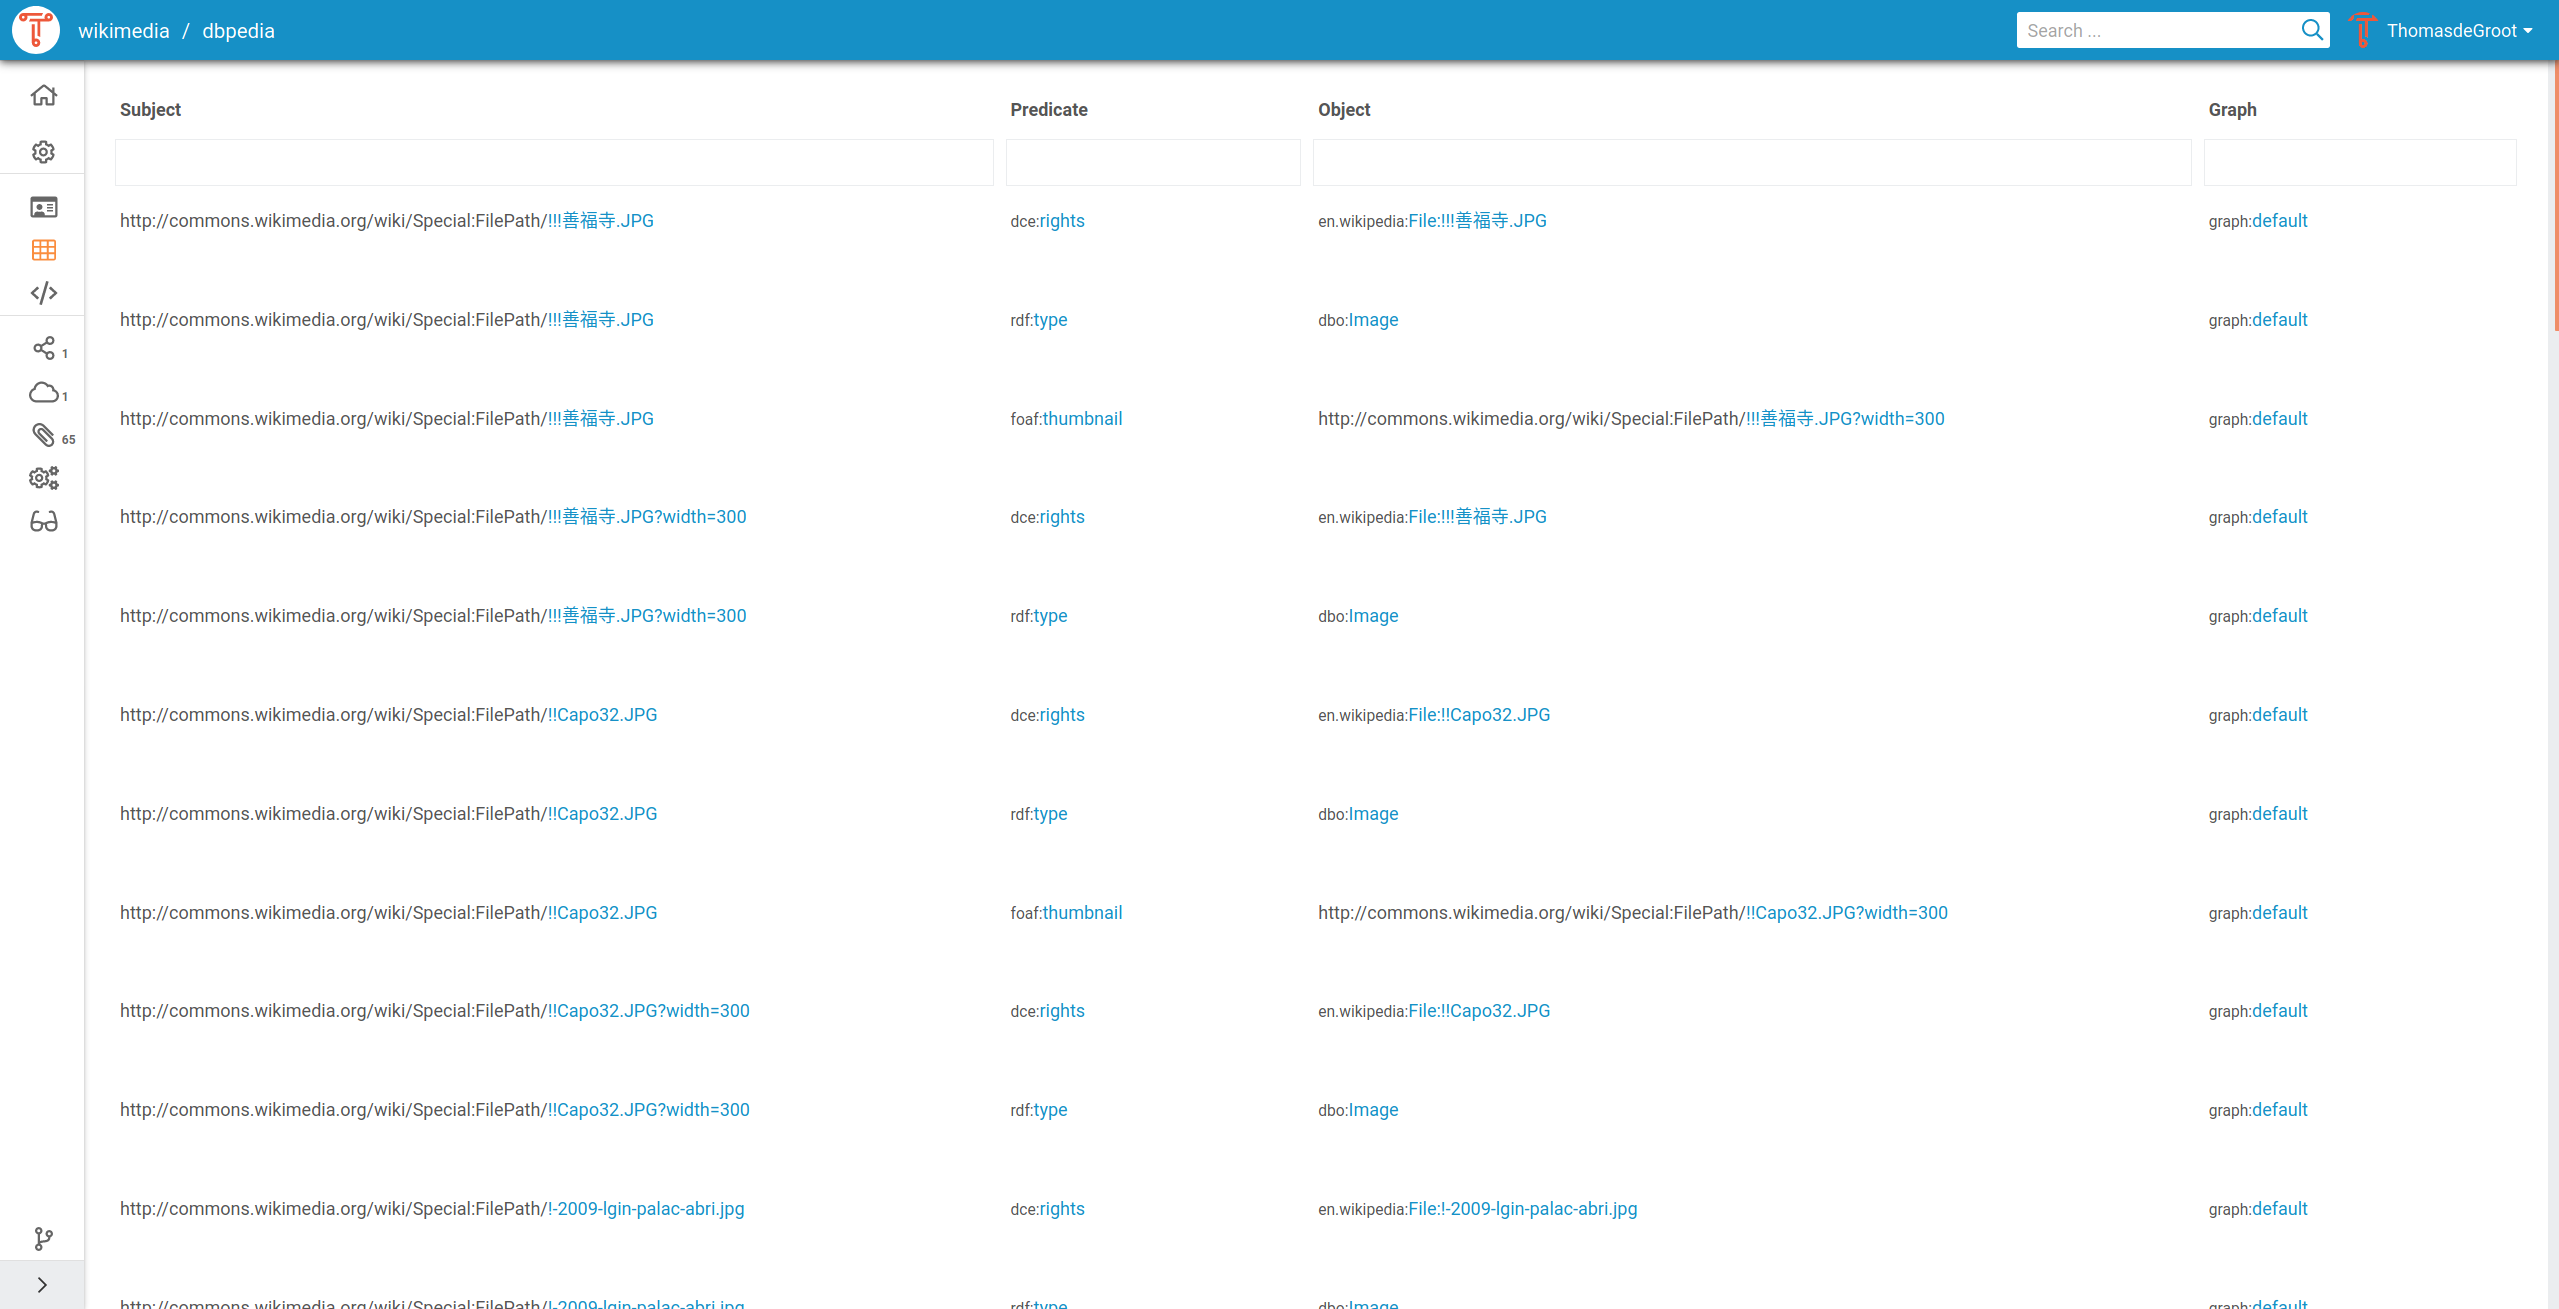
The linked data Table can be used to perform simple queries by filling in the subject, predicate, object, and/or graph using the text field.
Terms in the linked data Table can be dragged and dropped between columns. This allows a simple form of graph navigation. For example, an object term can be dragged to the subject column in order to show the triples in which that term appears in the subject position.
Insights
The insights page has been developed to give you a succinct overview of the linked data at hand. It holds two views: the class frequency and the class hierarchy view.
Class frequency
The class frequency diagram shows how often classes and properties appear in a graph. The drop-down on the top of the visualization selects the graph for which the class frequency is drawn. The visualization shows the 10 most frequent classes in the selected graph. The exact number of occurrences can be seen when hovering over the bar of a class, also showing the complete IRI/prefixed IRI. When clicking on the bar of a class the node will expand and show the 10 most frequent predicates of that class.
Class hierarchy
The class hierarchy diagram shows the hierarchy of the dataset in three
different visualizations. Each of the diagrams are created by the
rdfs:subClassOf relations and the classes in the dataset.
TriplyDB has three different visualization methods for the classHierarchy:
- Bubbles visualization
- Treemap visualization
- Sunburst visualization
All three visualizations are interactive in two ways. It is possible to hover over them, which will show information about the layer the mouse is on, or to click on them, so the visualization zooms in one or more layers. For each visualization it is also possible to zoom out:
- Bubbles visualization: click the outside of the bubble
- Treemap visualization: use the breadcrumbs trail shown above the visualization
- Sunburst visualization: click the innermost circle of the visualization
When does the class hierarchy show?
- A class only appears in the class hierarchy tab if it has instances (connected to the class via
rdf:type). - The class hierarchy cannot be shown if it contains a cycle, meaning that some class is (indirectly) its own subclass.
Related
- Query data — the SPARQL IDE, Elasticsearch and GraphQL
- Supported file formats — what you can load
- SPARQL: the basics — writing the queries behind these views
- Linked data — what the table and the browser are showing you