Build your first flow
This tutorial builds a flow with three tasks: it imports the Iris flower dataset from triplydb.com, copies the observations of one species, Iris setosa, into a graph of their own, and validates that graph against the dataset's SHACL shapes. Then it runs the flow and looks at what it produced. It takes about twenty minutes.
Before you start
You need an account on a TriplyDB instance that has Flows switched on. If your account page has no Flow under New, it has not been switched on for your instance. The flow downloads a file from triplydb.com, so the instance needs to be able to reach the internet.
You do not need to write SPARQL: the one query in this tutorial is given in full.
1. Create the flow
On your account page, click New and choose Flow. Leave the Owner as your own
account, enter Iris setosa as the Flow name, and click Create flow.
The flow builder opens: an empty canvas, with the Flow elements panel on the left listing the task types you can use.
2. Import the data
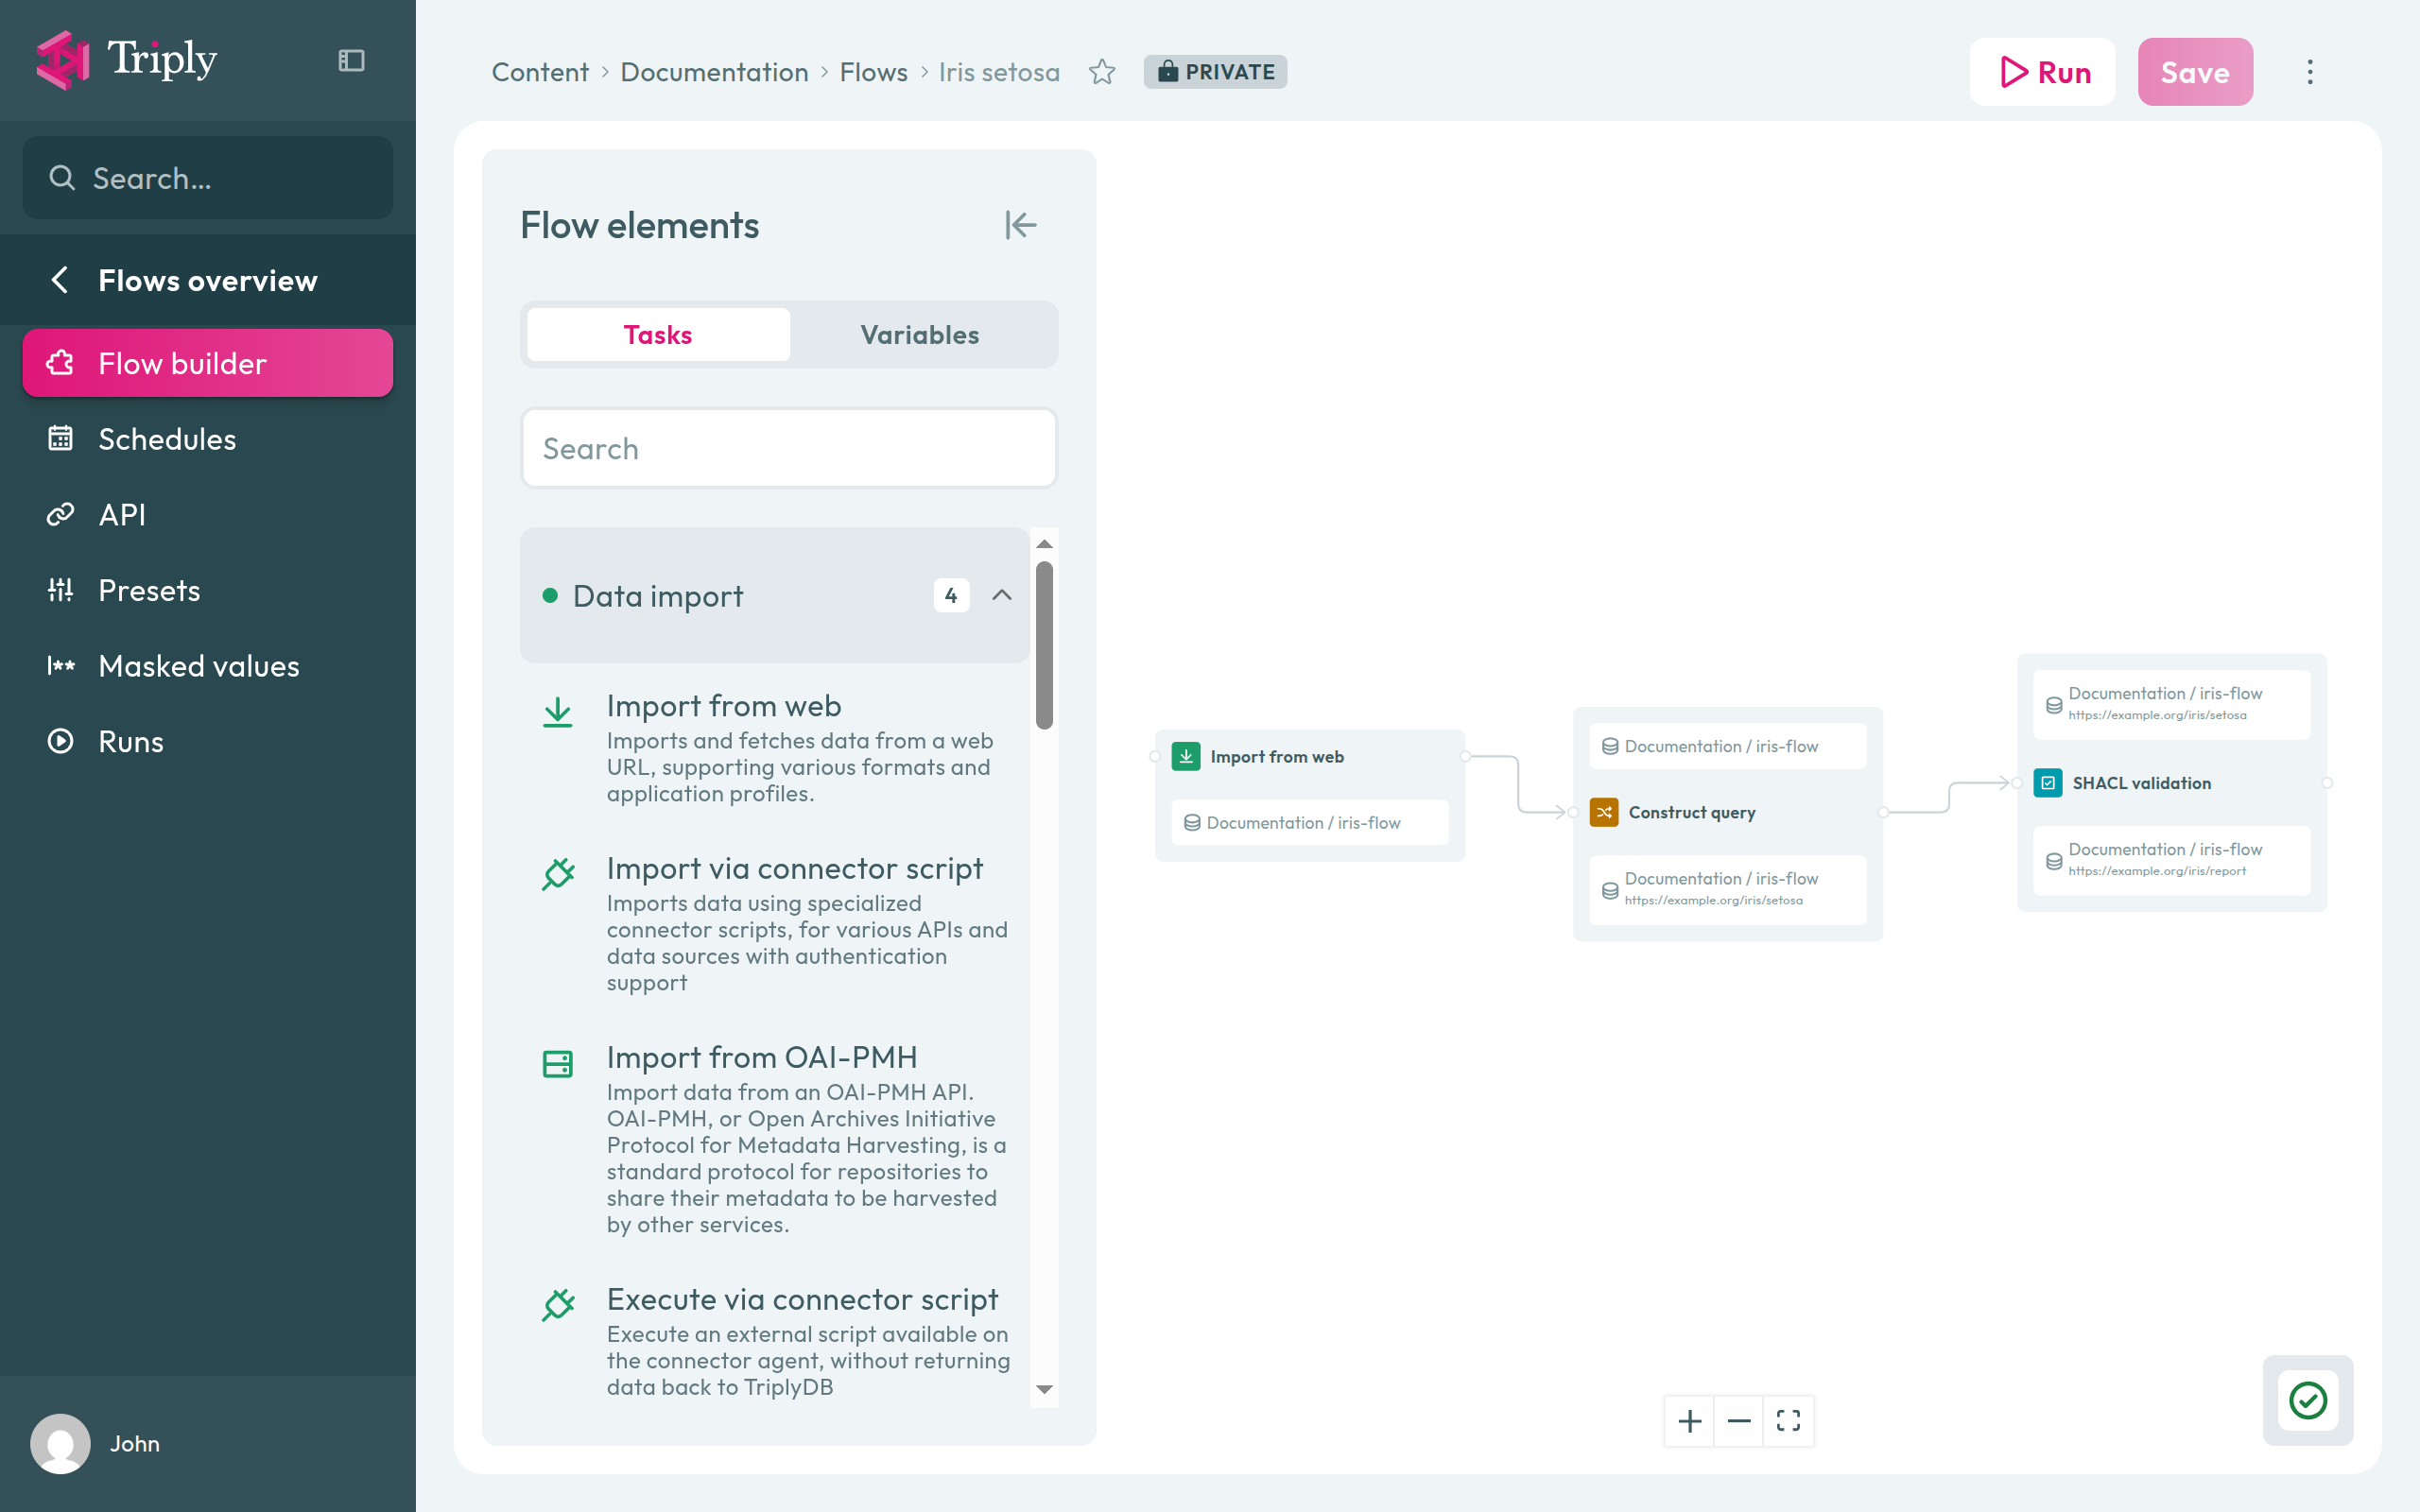
Drag Import from web from the panel onto the canvas. Click the card's title to open its settings on the right, and paste this address into Data URL:
https://triplydb.com/Triply/iris/downloadA task names where its result goes on the card itself. Click Select an output... on the card.
In the dialog, set Type to Dataset, choose your account under Account, type
iris-flow under Dataset name and pick Add "iris-flow" from the list. Click Save.
The dataset does not exist yet; the task will create it when the flow runs. The card now shows it as its output.
3. Select one species
Drag Construct query onto the canvas, to the right of the first task.
Connect the two: drag from the small circle on the right edge of Import from web to the circle on the left edge of Construct query. The arrow means run the import first.
Click Select an input... on the new card. Under Reuse a selector, click your
iris-flow dataset, then Save. Click Select an output..., set Type to Graph,
reuse iris-flow again, and type https://example.org/iris/setosa under Graph name, picking
it from the list. Click Save.
Now click the card's title, click Edit beside Query, and replace the query with:
prefix dimension: <https://triplydb.com/triply/iris/def/dimension/>
prefix dbr: <http://dbpedia.org/resource/>
prefix qb: <http://purl.org/linked-data/cube#>
construct {
  ?observation a qb:Observation ;
    ?p ?o .
} where {
  ?observation dimension:variety dbr:Iris_setosa ;
    ?p ?o .
}
Click Save in the query dialog. The query copies every statement about the setosa
observations, and states that each is a qb:Observation — the class the dataset's shapes
describe.
4. Validate the result
Drag SHACL validation onto the canvas, to the right of Construct query, and connect Construct query to it the same way.
On the new card, click Select an input..., set Type to Graph, click the
https://example.org/iris/setosa graph under Reuse a selector, and Save. Click
Select an output... and make it graph https://example.org/iris/report in iris-flow, as
before.
Click the card's title. Under Shapes graph, click the pencil, reuse the iris-flow dataset
and Save: the imported data brings its own shapes along.
The icon in the canvas's bottom-right corner turns into a green check: the flow is complete. Click Save at the top of the page.
5. Run it
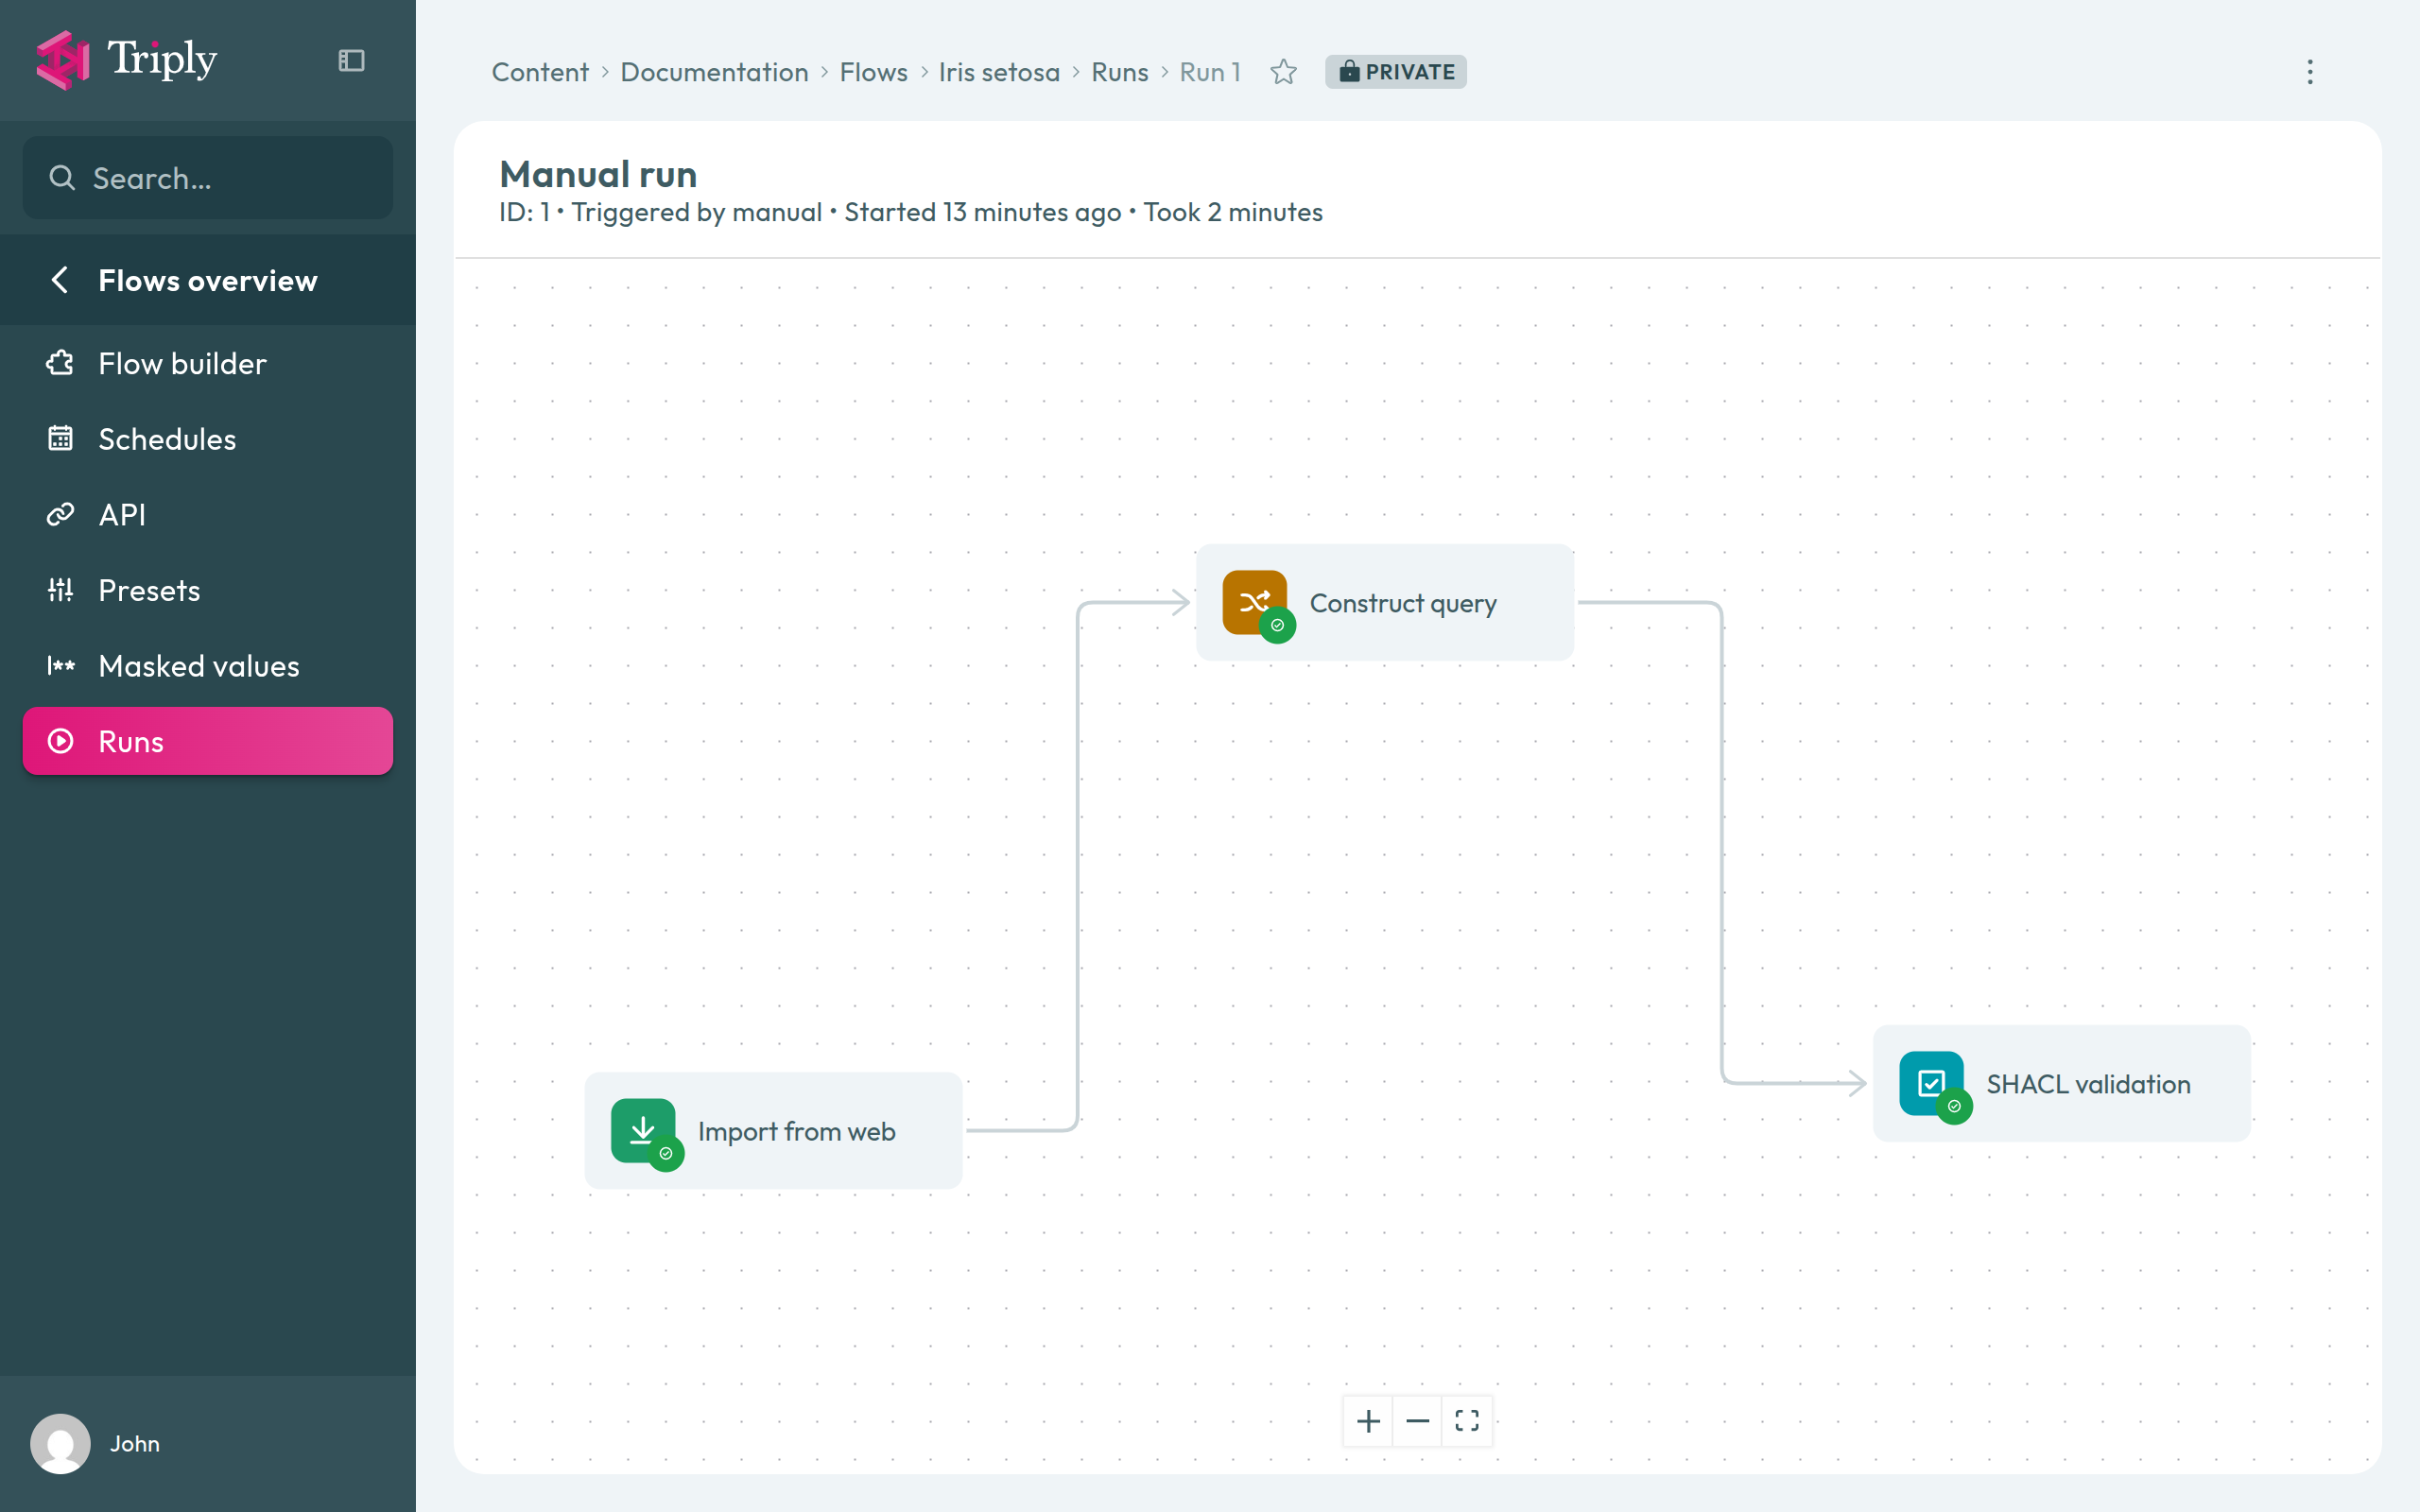
Click Run, then Run again in the dialog. The run's page opens, showing the same three tasks. Each gets a green mark as it finishes; the whole run takes a couple of minutes, most of it spent importing.
6. Look at what it made
Open the iris-flow dataset from your account page. Its graphs page lists seven graphs:
- the five graphs of the Iris dataset, which the import brought in;
https://example.org/iris/setosa, with 450 statements: 50 observations of eight statements each, plus the 50qb:Observationtypes the query added;https://example.org/iris/report, the validation report, with two statements. One of them issh:conforms true: every setosa observation fits the shapes.
What you built
A flow that anyone with access to it can run again with one click. Every task wrote to an ordinary dataset, so each step's result can be opened and queried — which is how you would find out where a flow goes wrong.
Tasks add to the graphs they write to. Run the flow a second time and the data graphs stay as they are, because the same statements are already there, but the report graph holds two reports.
Next steps
- Use variables in a flow to make the URL and the dataset name something you choose per run.
- Run a flow on a schedule, or from another system.
- Flows explains why tasks read and write datasets rather than pass data along, and what the edges really decide.
- Flow tasks lists everything else a flow can do.